South Dakota
U.S.
Rank
Rank
#51 F
Overall PPI Score: 53%
South Dakota, dead last at 51st with an F, is mired in rigidity. The absence of charters or scholarships leaves families in the Mount Rushmore State with virtually no alternatives.
South Dakota does not have charter schools.
South Dakota has numerous options when it comes to CTE and work-based learning opportunities. It also allows competency-based graduation requirements, giving students at least some opportunities in addition to their traditional setting.
Governor Larry Rhoden has voiced strong support for expanding school choice, backing Education Savings Accounts to give families more options beyond traditional public schools. Now it’s time for Governor Rhoden to turn that support into results—and deliver on...
South Dakota provides parents with limited power to customize their students' education. The budget for the small tax-credit scholarship program was recently expanded but will still reach fewer than 1 percent of students who need it statewide.
Even as innovation surges nationwide, high-spending states like California, New York, and Oregon still limit families' options, showing that dollars alone don't guarantee education freedom.
School report cards can be found under the “A-Z” tab or under the “Quick Links” section of South Dakota's Department of Education homepage. Report cards are comprehensive, providing information on student performance, college and career readiness, educator...

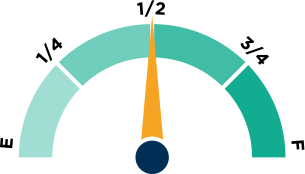
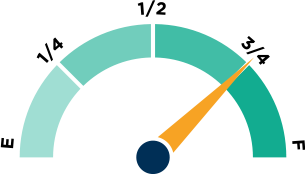
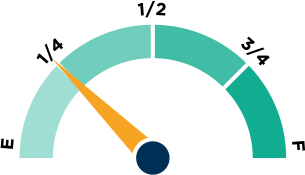
One of many data points to assess whether a state has the right policies in place to ensure teacher quality is the "use of student achievement data in teacher preparation accountability." How empty or full the fuel tank above is will give you the answer for your state.
South Dakota has a Blaine Amendment, and the South Dakota Supreme Court has interpreted it restrictively. "That Court has explicitly rejected the distinction between aiding students and aiding the schools they choose to attend." (Institute for Justice)